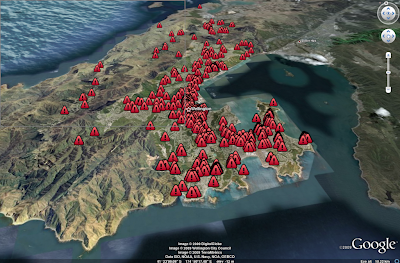
Reading this article about Wellington Hazards just makes me want to plot it on a map. It took a while, but here is a map of Wellington Hazards / Contamination. Below is a screenshots of the hazards on Google Earth and Google Maps (Google Earth shot nicely prepared by Cameron). Let me know what do you think?
Read on after the jump for hyper-technical explanation of how I made the map.
Here’s the lowdown on the technical wizardry. The data is based on http://static.stuff.co.nz/files/WCC-slur.pdf. I had to extract the data out from the pdf, obtaining a spreadsheet that looks like this:
No & STREET & City HAIL & CLASSIFICATION& CONTAMINANTSThe address leaves a lot to be desired. Having data like ‘Eastern’ for the city column makes no sense to anyone or a program. Cleaning that up and adding “Wellington NZ” would make it easier for geocoding. We now have this:
50 BUCKLE ST EASTERN Service Stations Verified History of Hazardous Activity or Industry
75 DARLINGTON RD EASTERN Landfill Verified History of Hazardous Activity or Industry
501 EVANS BAY PDE EASTERN Service Stations Verified History of Hazardous Activity or Industry
9 -11 KENT TCE EASTERN Storage Verified History of Hazardous Activity or Industry
HAIL & CLASSIFICATION& CONTAMINANTS Full Cleaned Address
Service Stations Verified History of Hazardous Activity or Industry 50 BUCKLE ST Wellington New Zealand
Landfill Verified History of Hazardous Activity or Industry 75 DARLINGTON RD Wellington New Zealand
Service Stations Verified History of Hazardous Activity or Industry 501 EVANS BAY PDE Wellington New Zealand
Storage Verified History of Hazardous Activity or Industry 9 -11 KENT TCE Wellington New Zealand
We can now geocode, using the helpful spreadsheet geocoder (instructions here). The only limitation was that only 100 addresses can be geo-coded at one time. But that’s fine as I only have 592 addresses.
Now here is the tricky bit, there is no good way to get items from a spreadsheet onto a map. The best way I could was use KML. I used the Spreadsheet Mapper v2.0, but it was far too painful with the browser locking with just 600 rows. Here is the resultant spreadsheet: http://spreadsheets.google.com/pub?key=tXlYA3d_eh42qOboocs8zug&output=html. I will most likely use PostGis and the asKML function next time.
Data spreadsheet: http://spreadsheets.google.com/pub?key=t_4WKBgw34UvW_zQMChuVKw&gid=0
Google Maps (my maps): http://maps.google.co.nz/maps/ms?ie=UTF8&hl=en&msa=0&msid=105368590499327803003.000475dc20f9a8d9d5142&t=h&z=11
KML file (.kml): http://maps.google.co.nz/maps/ms?ie=UTF8&hl=en&t=h&msa=0&output=nl&msid=105368590499327803003.000475dc20f9a8d9d5142

