
Here’s a behind the scenes write-up for my Mix and Mash NZ mashup.
Check it out here :
This mashup attempts to show land and waste data as it changes, and hopefully illuminates any improvements of our environmental impact as well as regressions.
The journey
It started out as an idea to gather all kerb recycling data from all 75 odd local councils in New Zealand. That meant scraping the data off the websites of various local and unitary councils. I quickly backed away once I found that lots of councils forbade any re-use, and the data that’s available is too inconsistent for me to compare and visualize.
Therefore much time and effort was spent looking for suitable data. I was interested in mainly environmental type data, which was to found mainly on the Ministry for the Environment website. I was also interested in regional level data, instead of a single national figure, which wasn’t that interesting .
In the end, I found suitable data for land use, rates, farm animal counts, population, and waste. Given more time, I would have hunted for transport data, which would then completely encompass all the major responsibilities of a regional council.
Putting it together
This mashup was made with Ruby on Rails, TileMill (http://mapbox.com/tilemill/), d3 (http://mbostock.github.com/d3/) and polymaps (http://polymaps.org/)
The excellent Koordinates.com put up a CC licensed shapefile of various land types in New Zealand. Instead of reaching for the de-facto choice of Google maps, this time I chose to try my hand at creating custom map tiles from that data. This had the advantage of being able to design the map to be far friendlier for statistical visualizations like cartograms, etc.
TileMill is simply a brilliant piece of software, which allows once to pull data from various sources and create beautiful maps, using any style you want. In addition, there are options for mouseover and click events.
There is an export function which will allow you to host the map tiles online ala Google Maps. I chose to utilise the hosted service at TileStream (http://mapbox.com/#/tilestream). It is completely possible to self-host as well, as the hosting code has been made available athttps://github.com/mapbox/tilestream.
The final map I produced using TileMill can be seen at http://www.landandwaste.co.nz/land.
Importing and processing the tabular data seen on the mashup was just a matter of using a combination of Google Docs, Google Refine, and csv files. Choosing a suitable graphical representation for each set of data was slightly tougher. I used a combination of sparklines, quantile maps, and just plain text. This was done using d3 and polymaps.
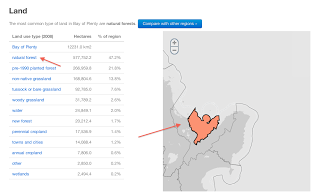
|
|
| Land use area visualization (example here for Bay of Plenty) |
|
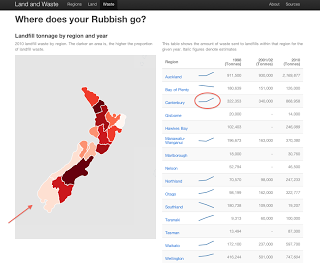
|
| Waste visualization for each region in New Zealand |
Where to from here
It was a huge learning experience. I learnt that creating something useful is very possible, and takes less time than I expected. Creating something polished requires far more time. I will definitely find a designer or improve my own design skills next time.